
What do we do?
Our Analysts have advanced skills in the following (to name just a few):
Analytics tools: Excel, Power BI, Tableau, Python/R, SQL, Google Analytics, etc.
CRM / project tools: Notion, Trello, Asana, HubSpot.
Data storage: Google Cloud, AWS, or Microsoft Azure.
Reporting templates: Standardized PDF/PowerPoint dashboards or online portals
Example Report Dashboards:
(Open Links to interact and explore)
Strategic FP & A Report
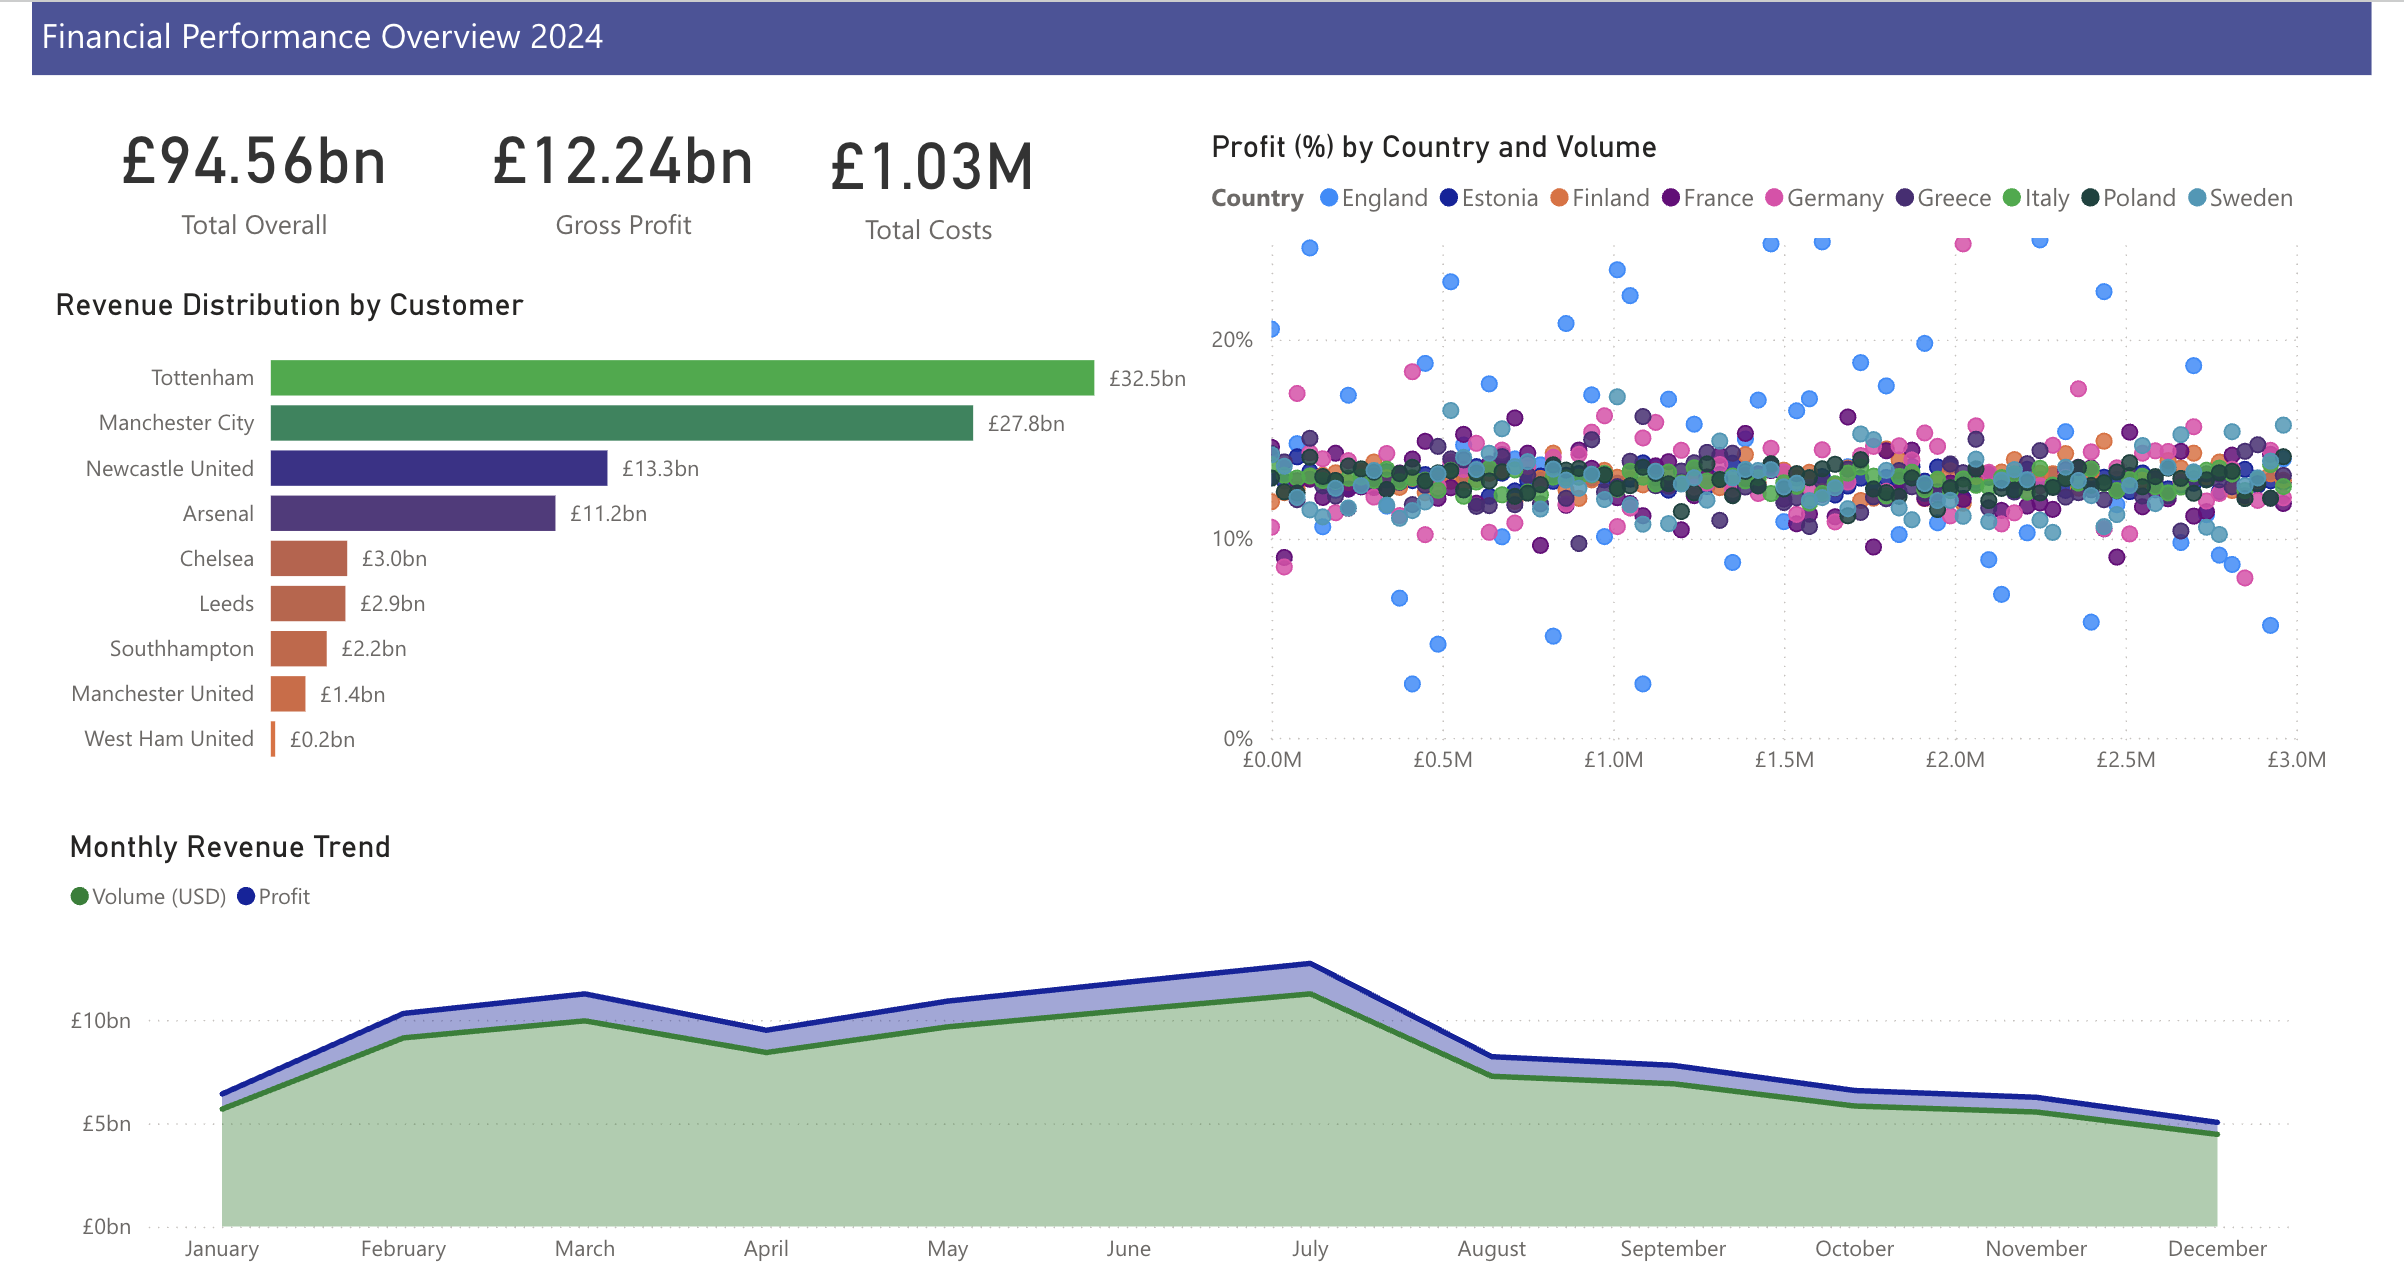
This analysis focuses on financial performance trends derived from transactional data, aiming to provide strategic insights for the FP&A team. The dataset consists of 62,828 records covering multiple financial metrics, including revenue, transaction volume, gross margin, and cost per
transaction across different countries and customers.
Health Insurance Claims Processing Analysis
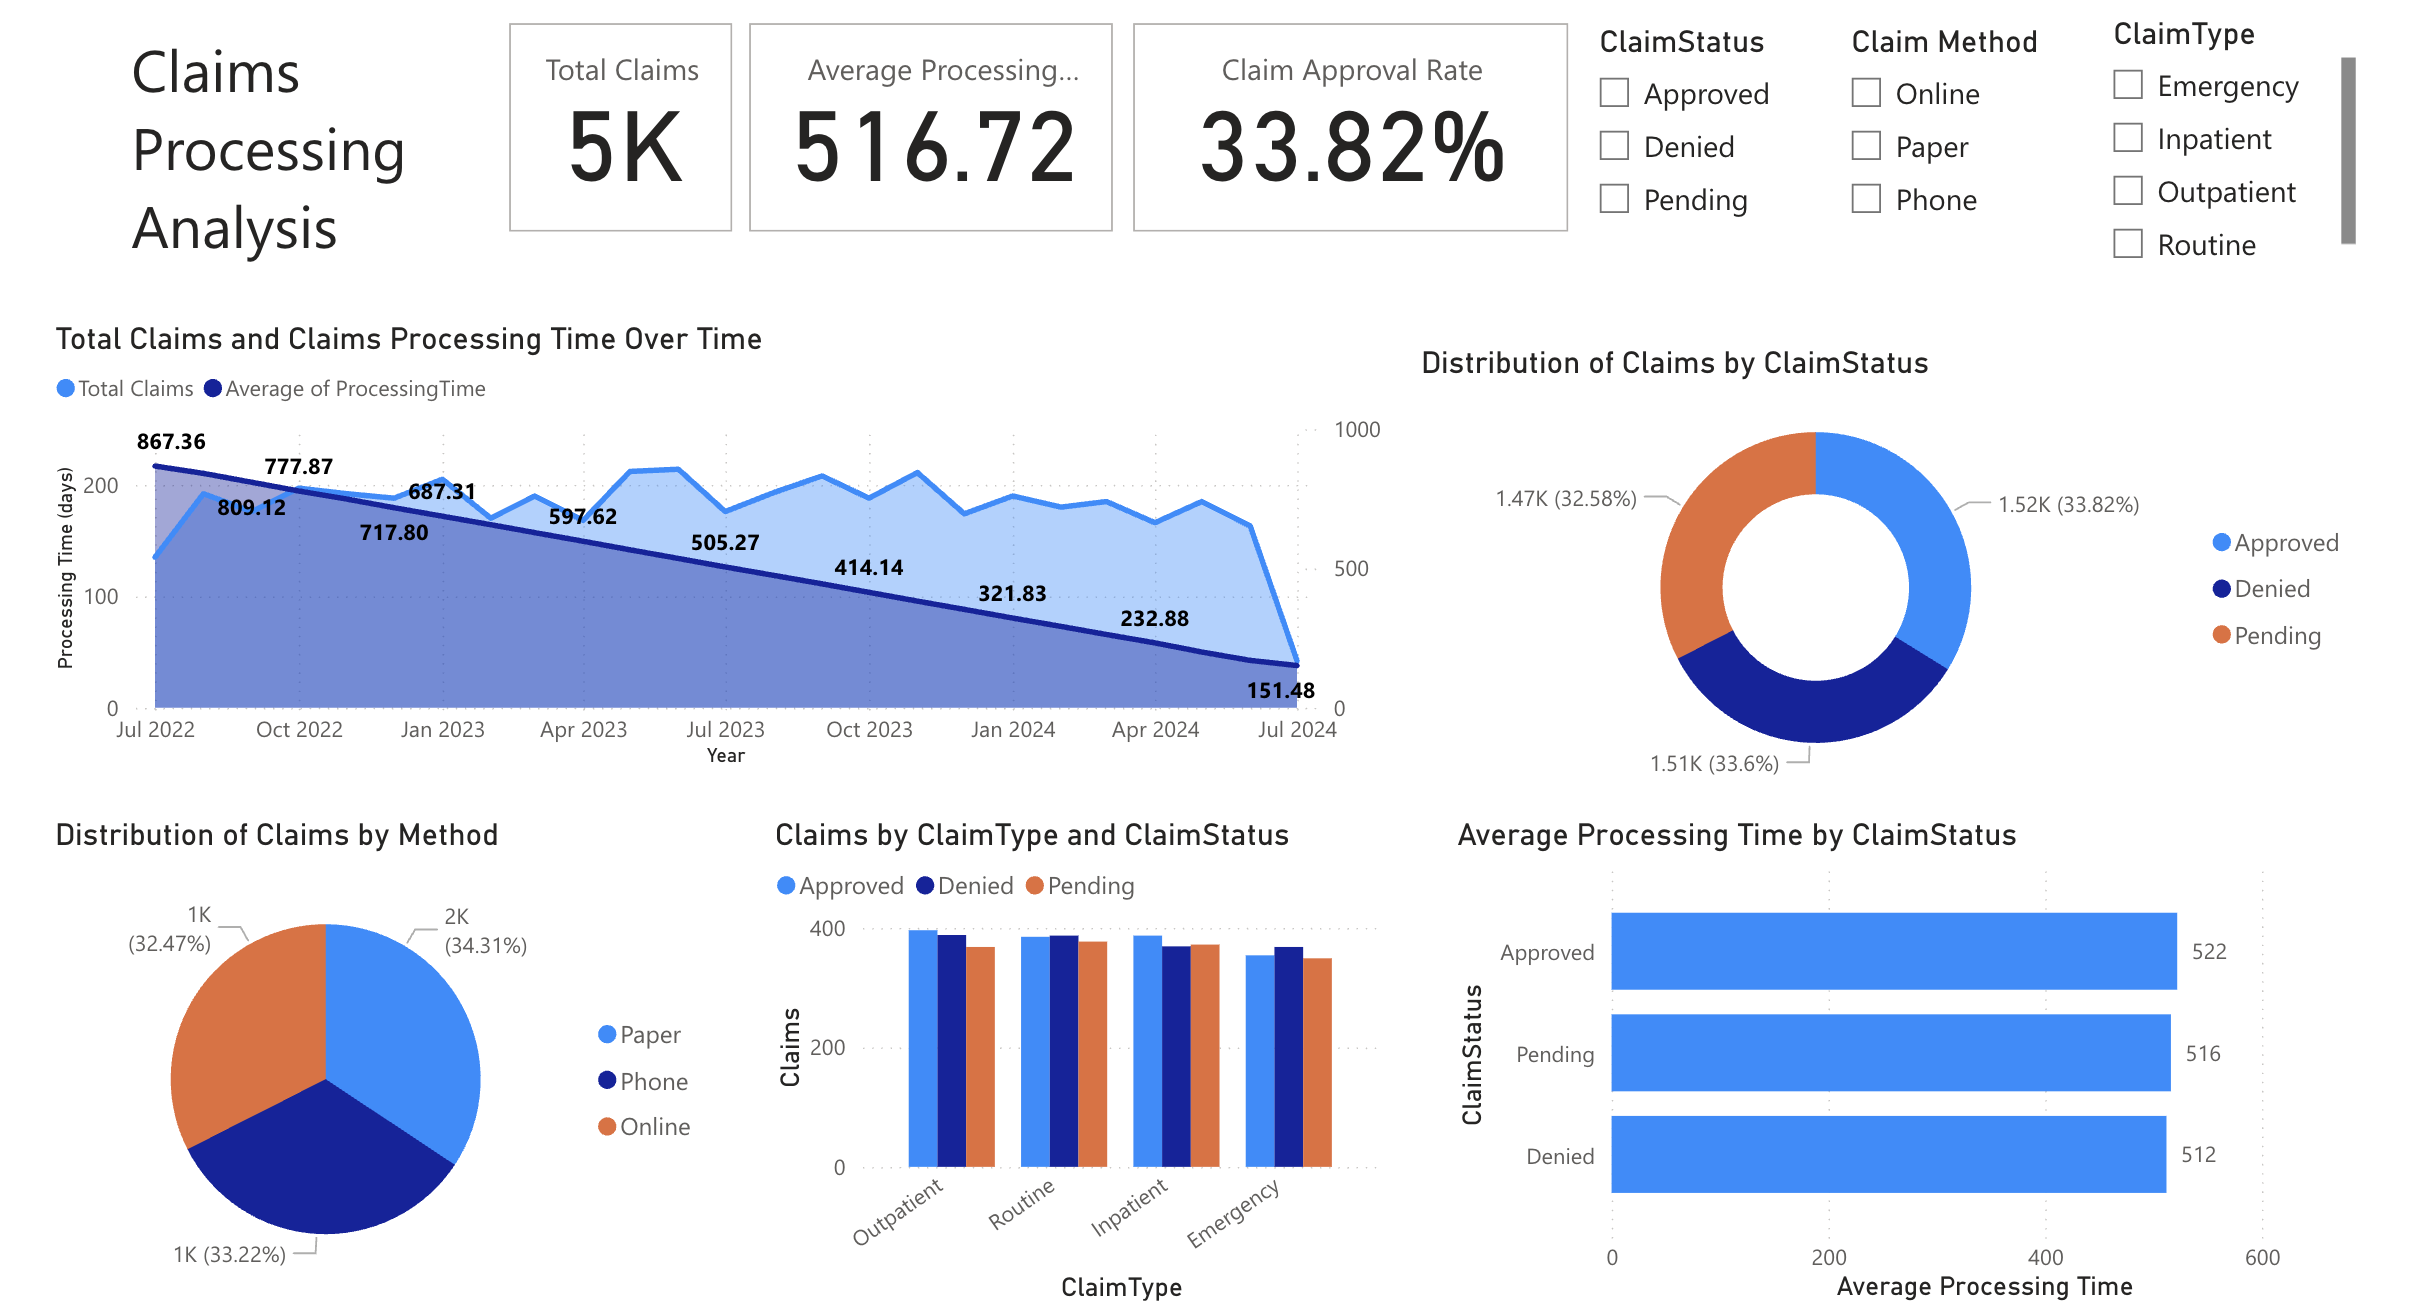
Interactive, comprehensive tool that provides stakeholders with valuable insights into claims processing, financial trends, demographics, fraud detection, and time-based analysis. I ensured data accuracy and optimization through Power Query for cleaning and transforming the dataset, while establishing an efficient star schema for better performance and seamless interaction.
The report includes key metrics like Claim Approval Rate, Claim Denial Rate, and Year-over-Year Claim Amount Growth, and offers interactive features such as slicers, filters, and drill-through capabilities for in-depth exploration. The visualizations were designed for clarity and accessibility, enabling both technical and non-technical users to derive actionable insights.
By publishing the report to Power Bl Service with automated data refreshes and real-time alerts, stakeholders are provided with continuous, up-to-date insights. The report drives strategic decision-making, identifies operational efficiencies, and supports cost-saving initiatives, all while fostering a data-driven approach across the organisation.