1. Define Dashboard Goals
For a Financial Planning & Analysis (FP&A) dashboard, the aim is to answer key strategic finance questions, such as:
How are revenues and expenses trending over time?
Are we meeting our financial targets and budgets?
What’s driving profitability across departments or regions?
How do forecasted figures compare with actual performance?
Where can we improve financial efficiency or resource allocation?
2. Data Wrangling
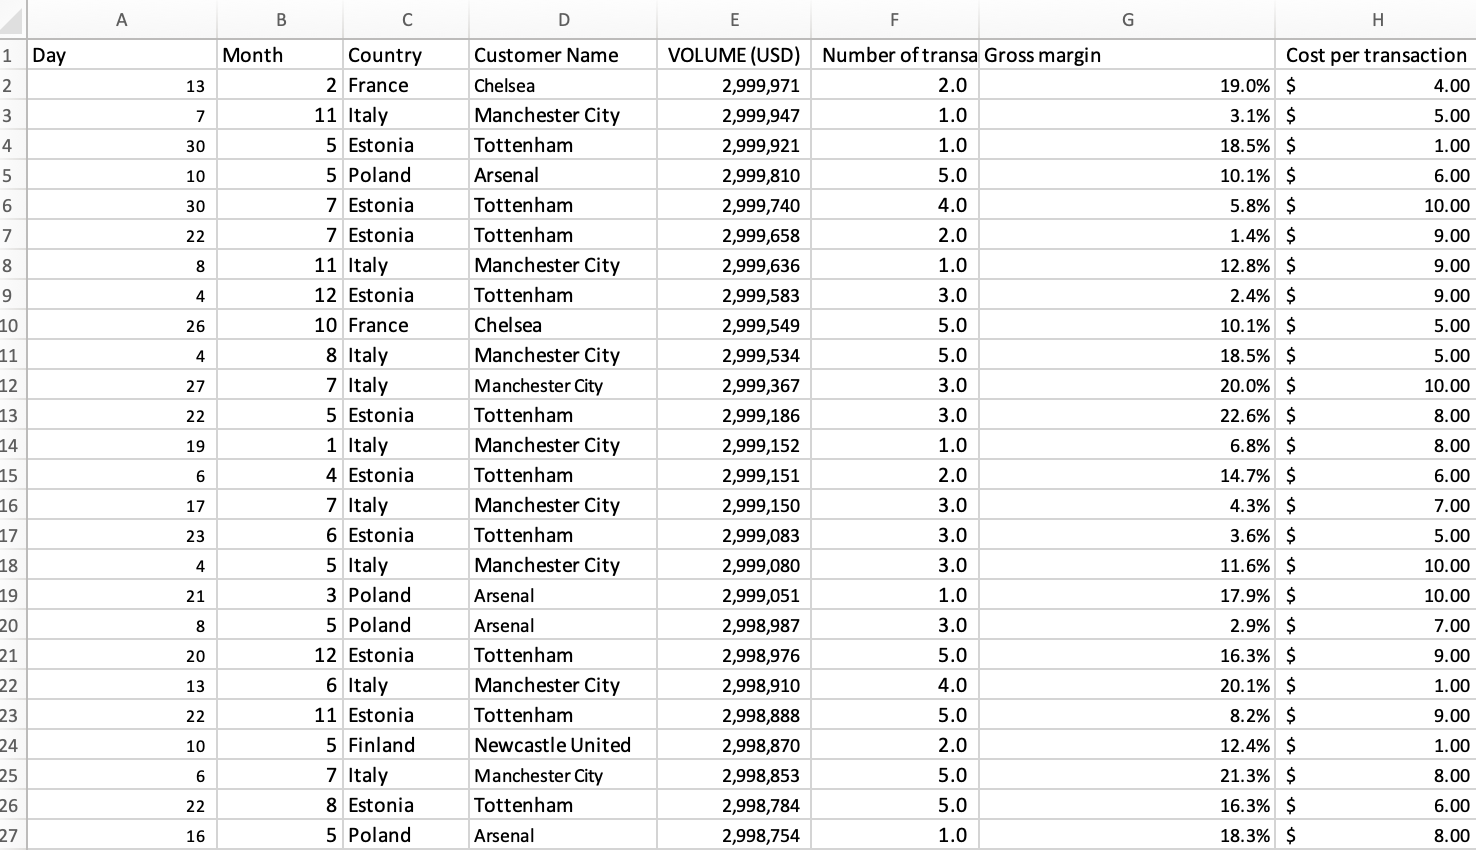
Below is an example of financial data (revenue, expense, and forecast tables) that gets cleaned, consolidated, and structured for analysis.
We integrate multiple data sources — budgets, accounting systems, and projections — to create dynamic reports and visualizations that track performance, forecast cash flows, and identify financial trends.
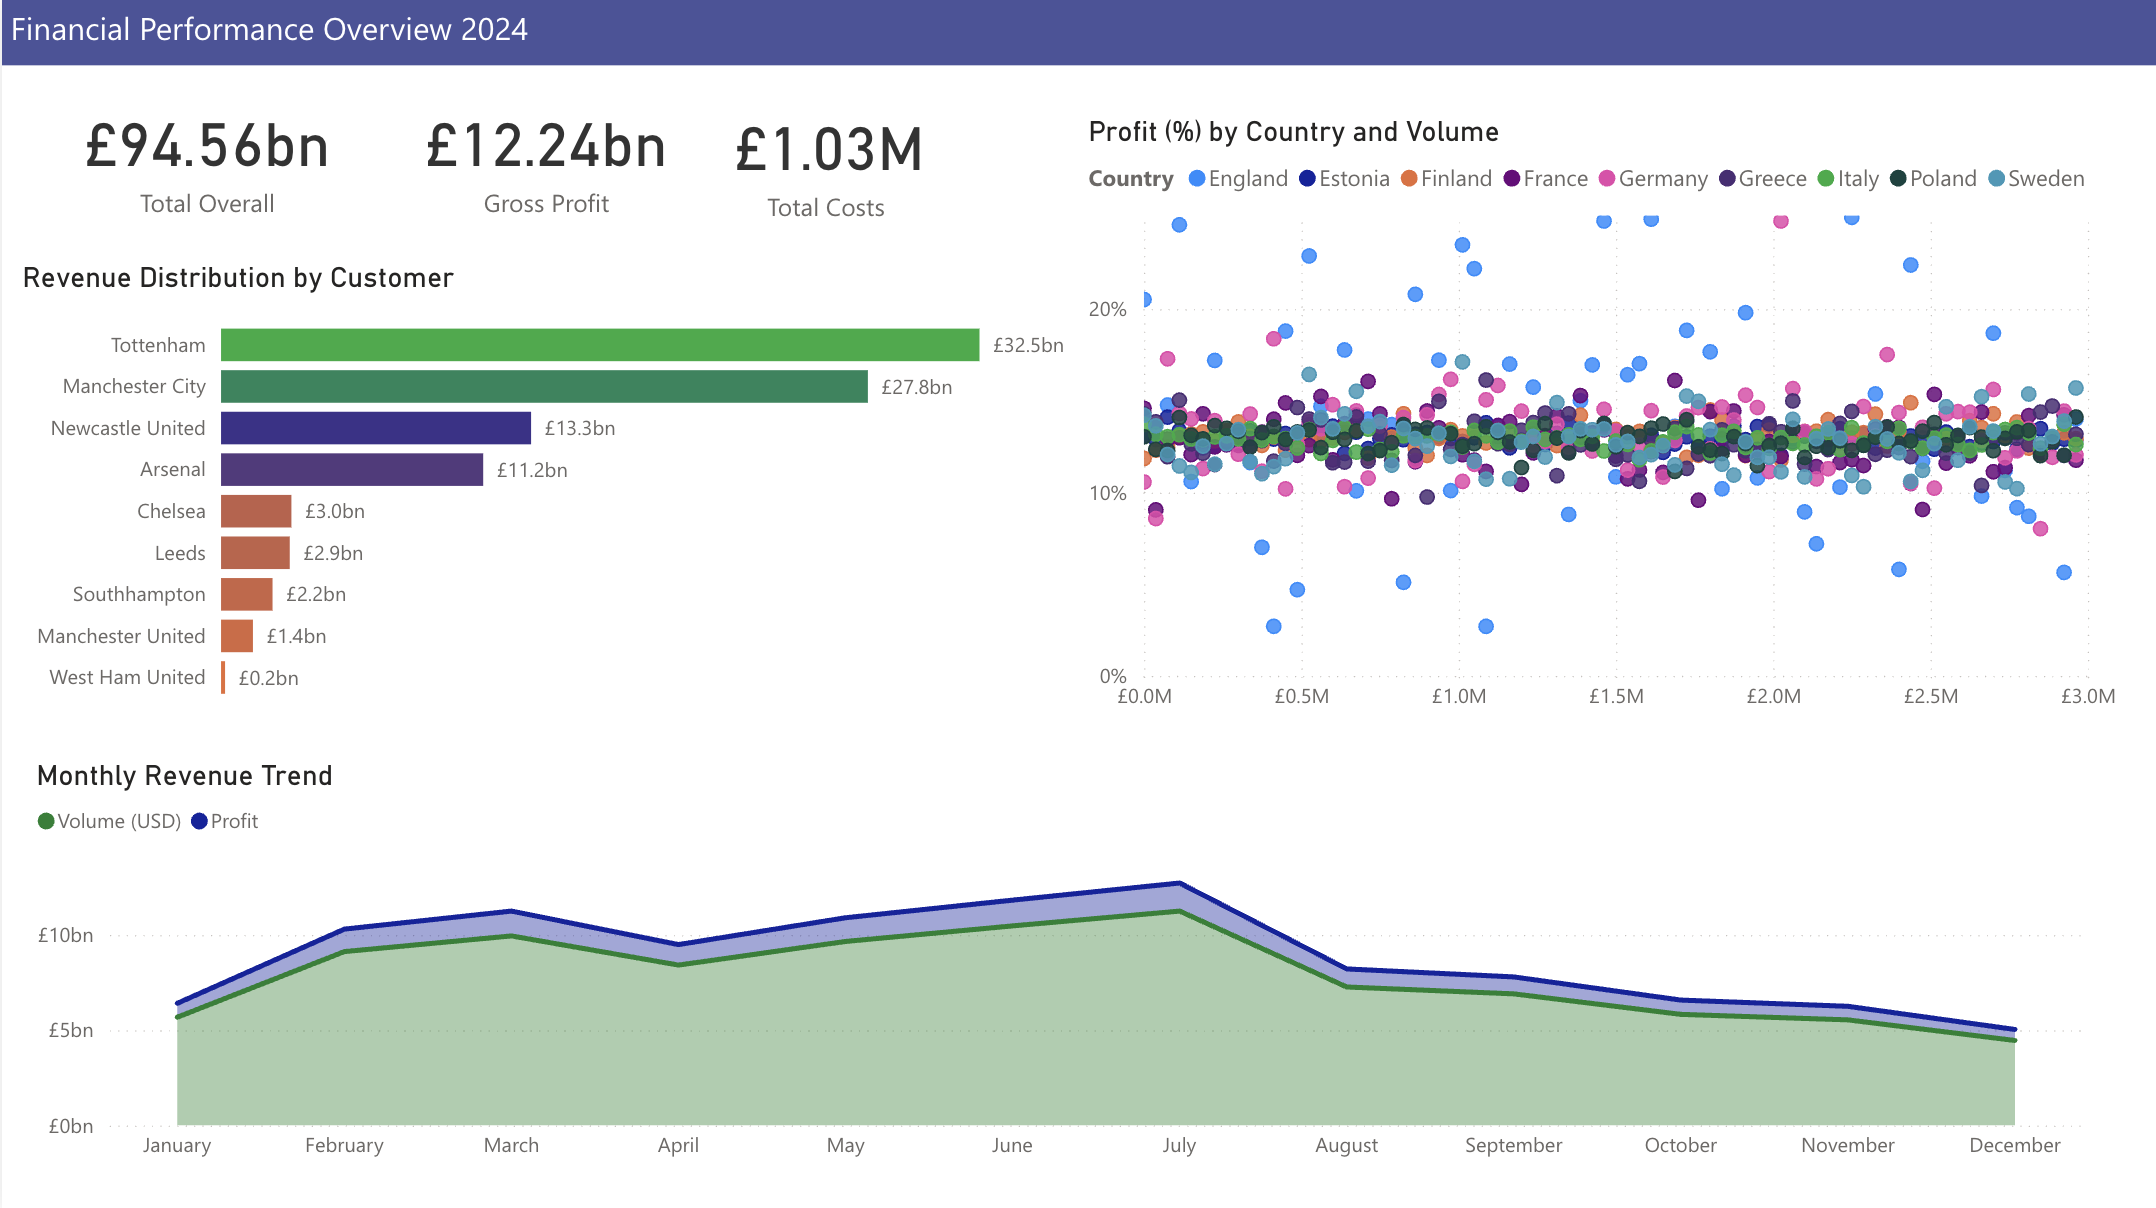
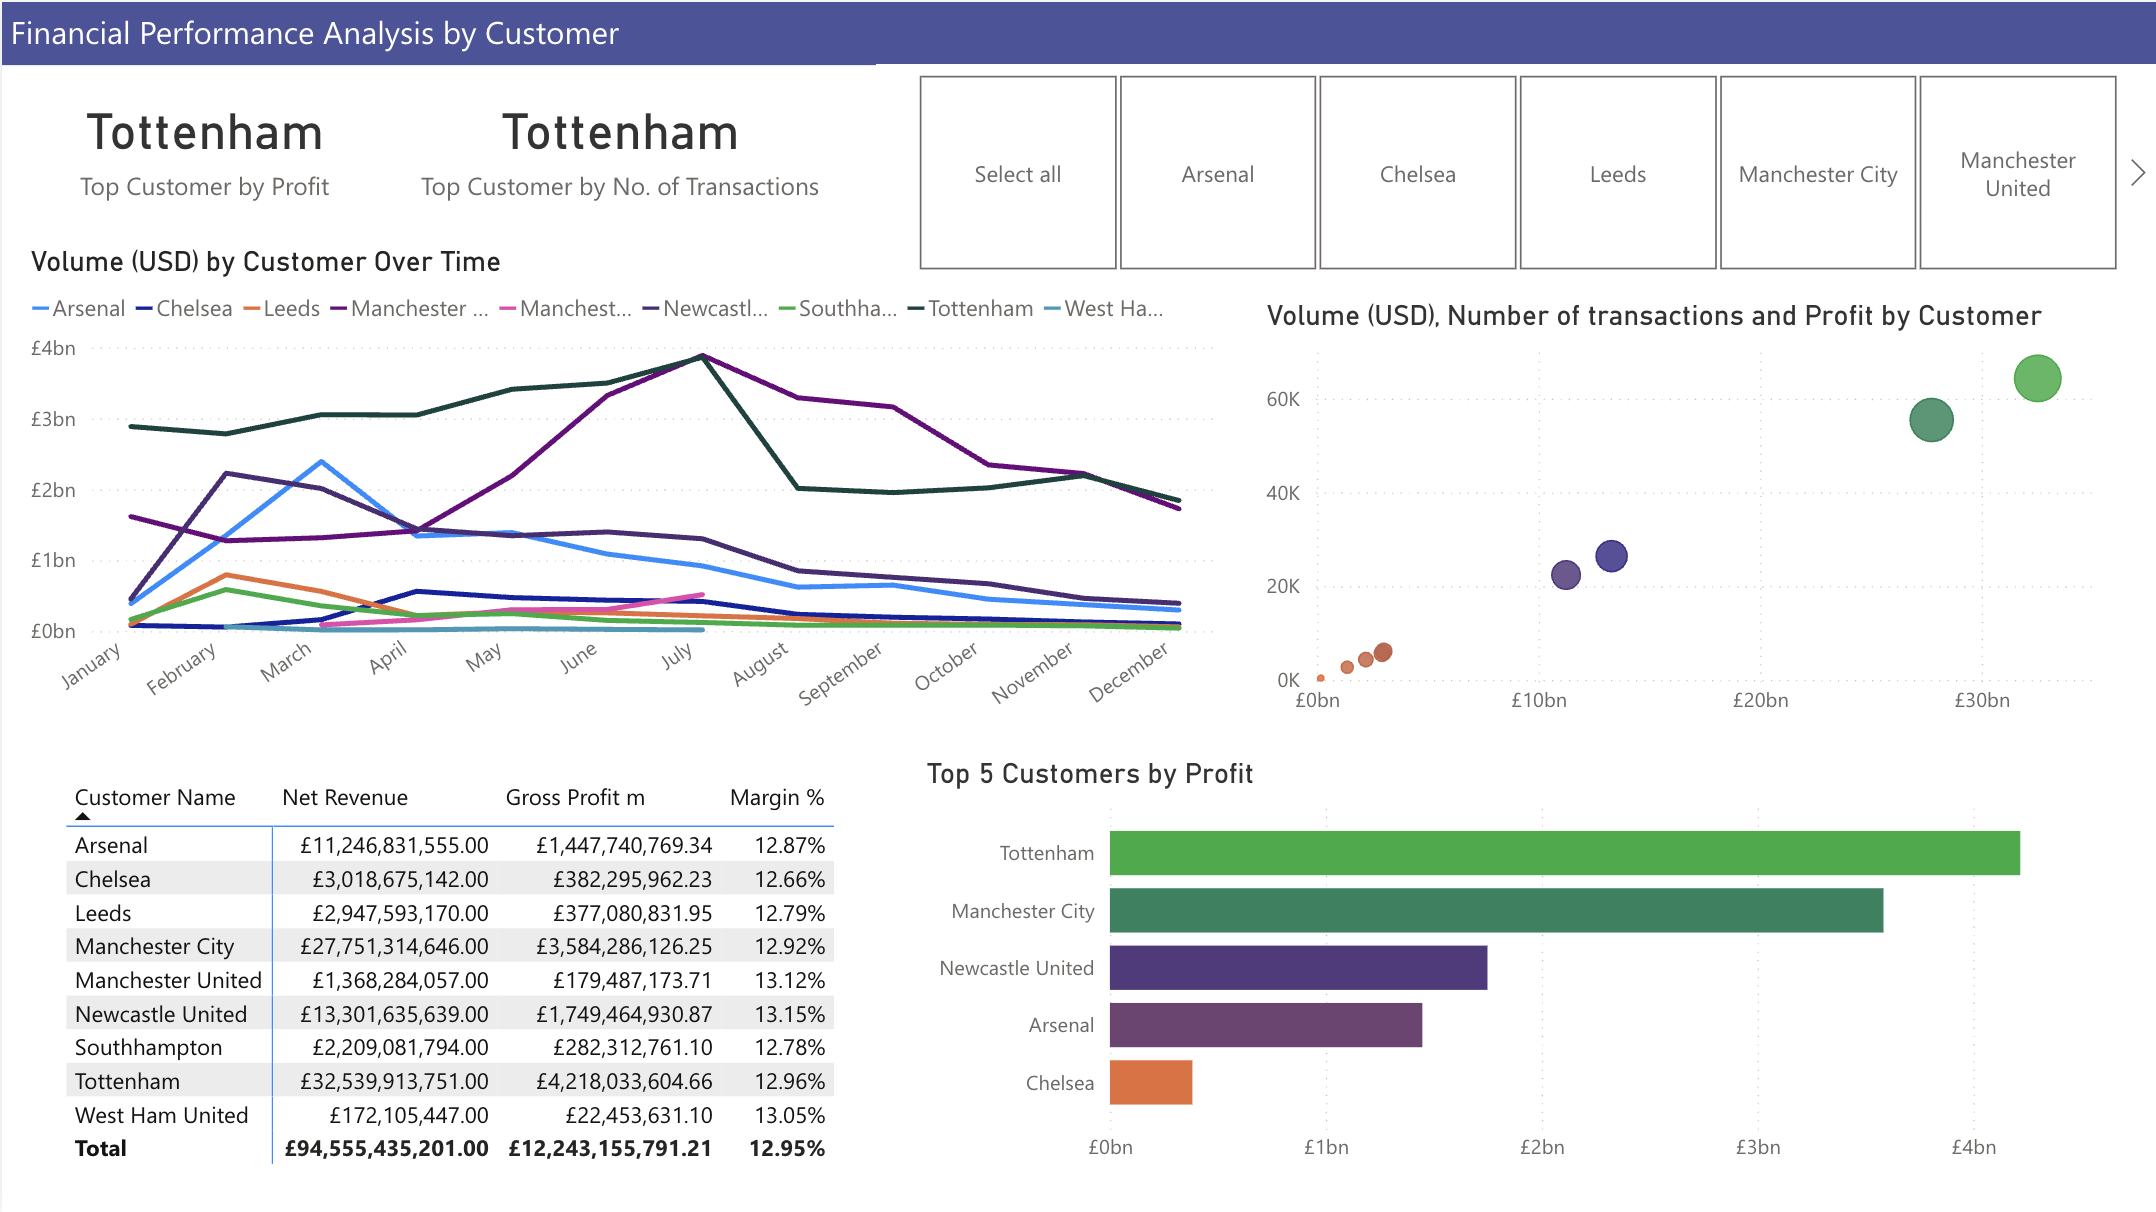
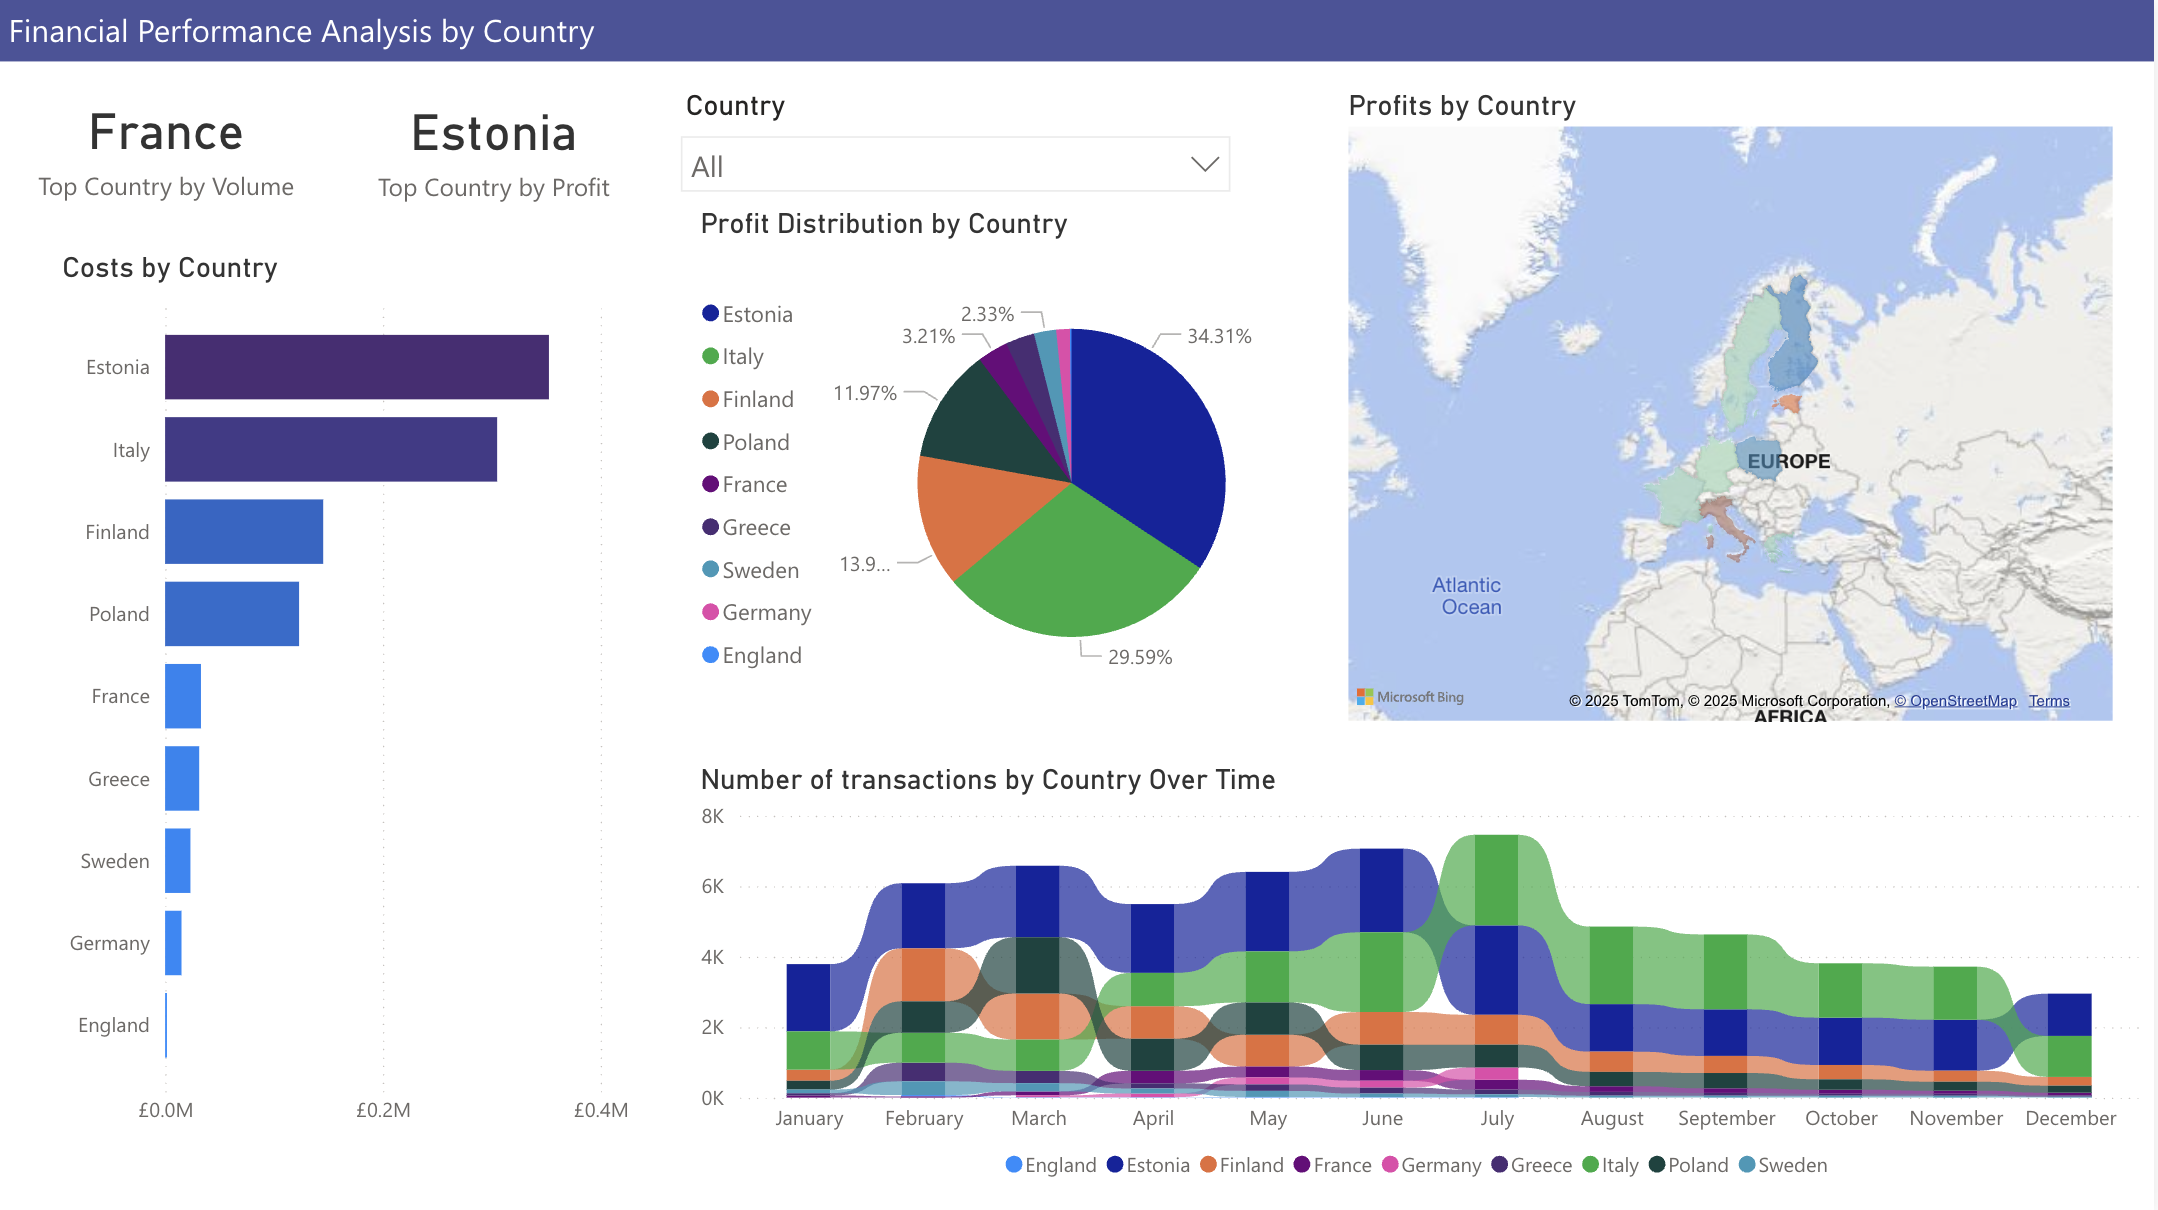
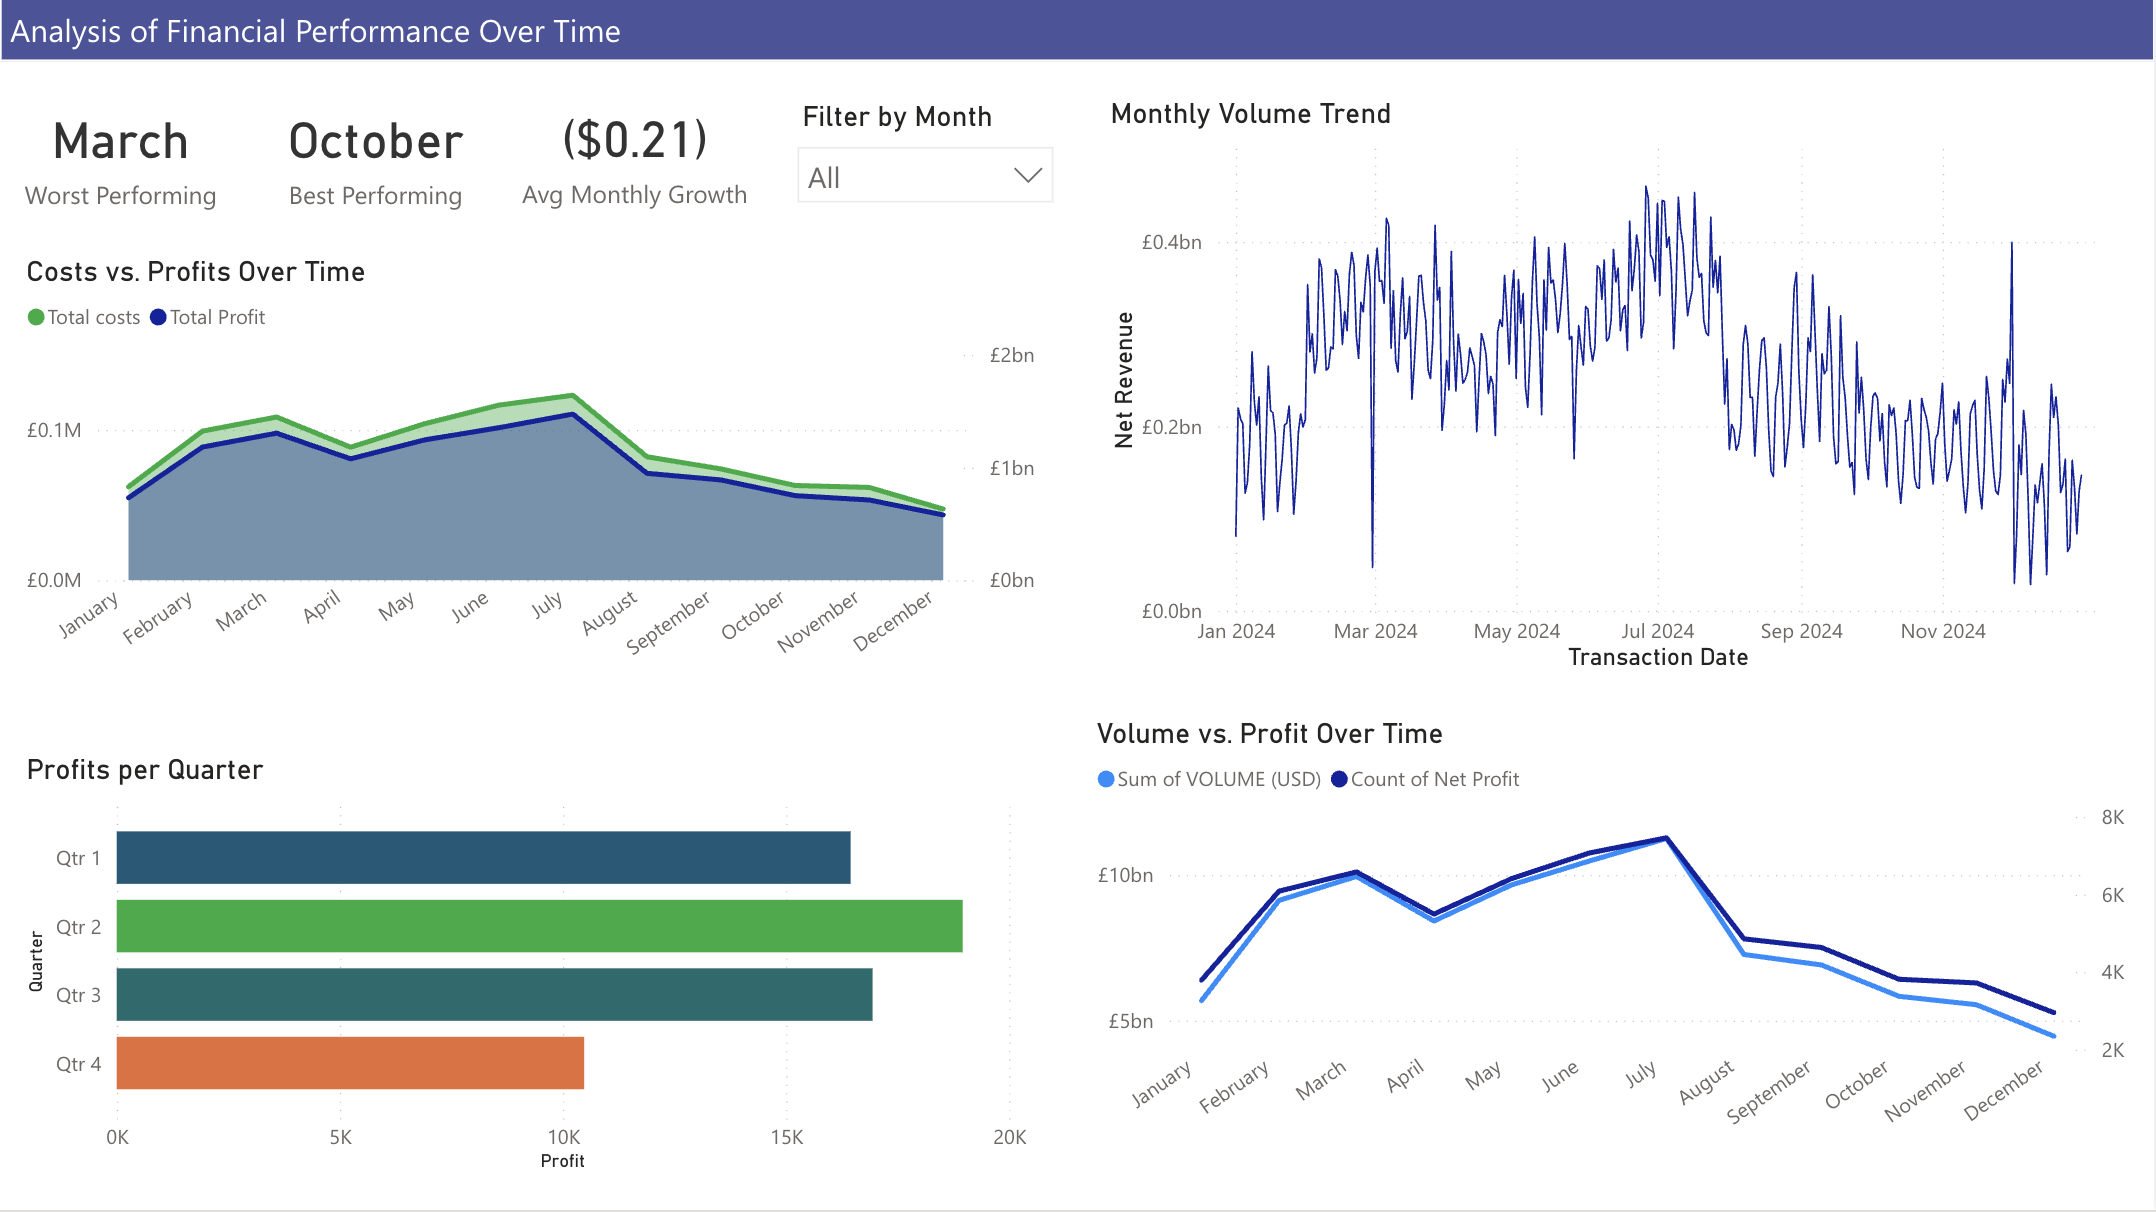
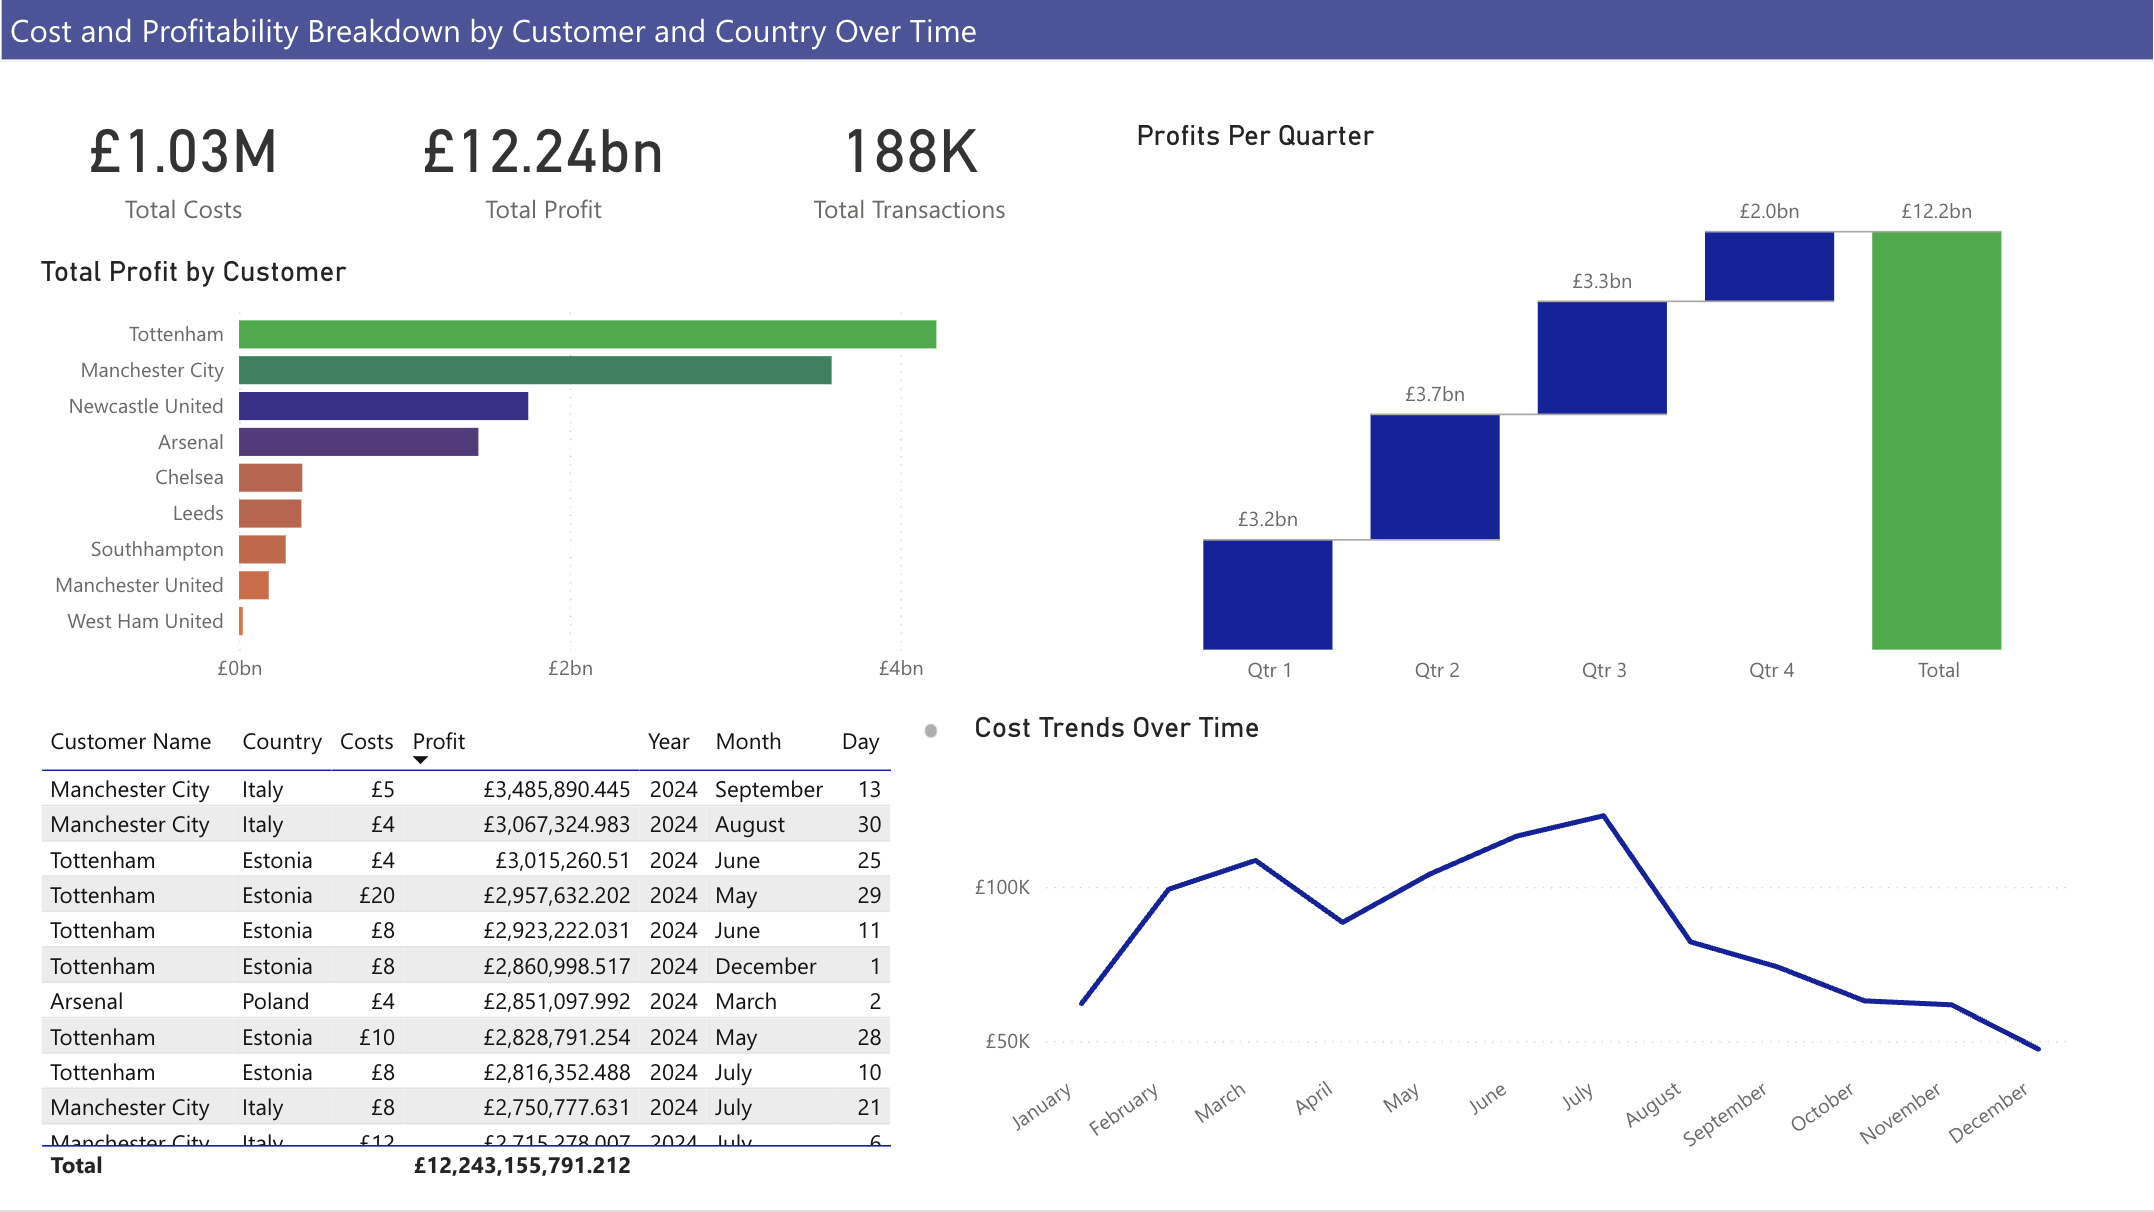
3. Communicate Insights
Once the interactive financial dashboard is created (example below) , the results are presented to leadership through visual summaries that highlight trends in revenue, cost performance, and variance against forecasts.
Clear visuals and commentary make it easy for executives to see where the business is over- or under-performing, and what key drivers are influencing outcomes.
4. Enable Action & Ongoing Improvement
Stakeholders use these insights to refine budgeting, allocate resources more efficiently, and adjust forecasts.
Automated data updates and scheduled reporting ensure continuous monitoring of performance and quick response to financial changes.